
networkD3
networkD3 패키지는 htmlwidget 패키지를 바탕으로 D3 기반의 네트워크 시각화를 가능하게 해준다.
기존의 igraph 패키지로는 만족스러운 모양새의 그래프를 만들기 힘들다고 생각해서 gephi와 d3를 사용하고 있었는데 d3 기반의 시각화를 R로 빠르게 구현할 수 있어서 관심을 가지게 되었다.
물론 세세한 부분까지 변경하는 것은 조금 무리가 있을 것 같지만 처음 d3로 force layout을 만들 때 고생했던 것을 생각하면 간단한 코드로 이렇게 force layout을 구현할 수 있다는 것 만으로도 상당히 유용하게 사용할 수 있을 것 같다.
이렇게 생성한 그래프는 html 형태로 export 할 수 있고, RMarkdown 문서에 바로 첨부할 수도 있다
이 글에서는 d3 그래프가 제대로 표시되지 않기 때문에 실제로 실행되는 결과물을 보려면 링크 에서 확인할 수 있다
Data
http://blog.thomsonreuters.com/index.php/mobile-patent-suits-graphic-of-the-day/
위 링크는 모바일 관련 소송에 대한 그래픽 자료이다. 해당 데이터를 d3를 이용해 네트워크 형태로 시각화한 자료는 여기에서 확인할 수 있다. 이 글에서는 link데이터를 가져와서 networkD3 패키지로 시각화 하는 작업을 진행할 것이다
library(networkD3)
library(dplyr)
시작하기 전에 네트워크 시각화를 하는데 필요한 데이터의 형태에 대해서 알아볼 필요가 있다.
네트워크 형태로 데이터를 시각화할 때 필요한 데이터는 두 가지가 있다
우선 노드(Node 또는 Vertex)에 대한 정보가 필요하고
이 각각의 노드를 어떻게 연결할 것인지(Link 또는 Edge)에 대한 정보가 필요하다
networkD3패키지에서 기본적으로 제공하는 데이터 중에서 소설 레미제라블의 인물 관계도를 나타내는 MisLinks와 MisNodes 데이터를 가지고 살펴보자
data(MisLinks, MisNodes)
head(MisNodes)
##              name group size
## 1          Myriel     1   15
## 2        Napoleon     1   20
## 3 Mlle.Baptistine     1   23
## 4    Mme.Magloire     1   30
## 5    CountessdeLo     1   11
## 6        Geborand     1    9
이름에서부터 느껴지듯이 MisNodes는 Node에 대한 데이터다
각각의 노드를 구별하는 열이 존재하고(여기서는 name열)
해당 노드가 그룹화 되어있는 경우 그룹을 표시해준다(group)
또 필수적이지는 않지만 각각의 노드가 가지는 값(중요도, 크기 등)이 있을 경우에 해당 값을 추가한다(size)
head(MisLinks)
##   source target value
## 1      1      0     1
## 2      2      0     8
## 3      3      0    10
## 4      3      2     6
## 5      4      0     1
## 6      5      0     1
MisLinks는 노드를 연결하는 정보에 대한 데이터이다
한 행은 source로 부터 target으로 연결되는 선 하나를 나타낸다
각 source와 target열의 값은 Node 데이터의 인덱스(0부터 시작)를 나타낸다
따라서 source = 1, target = 0은 source = Napoleon, target = Myriel을 의미한다
그러면 다시 돌아와서 우리가 처리할 데이터를 확인해보자
데이터는 JSON 형태로 되어있다
links = '[
  {"source": "Microsoft", "target": "Amazon", "type": "licensing"},
  {"source": "Microsoft", "target": "HTC", "type": "licensing"},
  {"source": "Samsung", "target": "Apple", "type": "suit"},
  {"source": "Motorola", "target": "Apple", "type": "suit"},
  {"source": "Nokia", "target": "Apple", "type": "resolved"},
  {"source": "HTC", "target": "Apple", "type": "suit"},
  {"source": "Kodak", "target": "Apple", "type": "suit"},
  {"source": "Microsoft", "target": "Barnes & Noble", "type": "suit"},
  {"source": "Microsoft", "target": "Foxconn", "type": "suit"},
  {"source": "Oracle", "target": "Google", "type": "suit"},
  {"source": "Apple", "target": "HTC", "type": "suit"},
  {"source": "Microsoft", "target": "Inventec", "type": "suit"},
  {"source": "Samsung", "target": "Kodak", "type": "resolved"},
  {"source": "LG", "target": "Kodak", "type": "resolved"},
  {"source": "RIM", "target": "Kodak", "type": "suit"},
  {"source": "Sony", "target": "LG", "type": "suit"},
  {"source": "Kodak", "target": "LG", "type": "resolved"},
  {"source": "Apple", "target": "Nokia", "type": "resolved"},
  {"source": "Qualcomm", "target": "Nokia", "type": "resolved"},
  {"source": "Apple", "target": "Motorola", "type": "suit"},
  {"source": "Microsoft", "target": "Motorola", "type": "suit"},
  {"source": "Motorola", "target": "Microsoft", "type": "suit"},
  {"source": "Huawei", "target": "ZTE", "type": "suit"},
  {"source": "Ericsson", "target": "ZTE", "type": "suit"},
  {"source": "Kodak", "target": "Samsung", "type": "resolved"},
  {"source": "Apple", "target": "Samsung", "type": "suit"},
  {"source": "Kodak", "target": "RIM", "type": "suit"},
  {"source": "Nokia", "target": "Qualcomm", "type": "suit"}
]'
jsonlite 패키지의 fromJSON함수를 이용해서 json데이터를 data.frame으로 변환시킨다
link_df = jsonlite::fromJSON(links)
이렇게 가져온 데이터는 link만을 담고 있기 때문에 node는 link의 source와 target 전체에서 unique한 항목만 추출한다
그리고 link에서 source와 target은 node의 인덱스를 가지고 표현해야 하기 때문에
node_df라는 data.frame에 0부터 시작하는 인덱스 번호를 부여하고
다시 link_df에 left_join해서 source와 target 각각의 인덱스를 가져온다
# node의 index 숫자는 0부터 시작해야 한다
# dplyr::row_number()가 1부터 숫자를 매기기 때문에 거기서 1씩을 빼도록 한다
node_df = data.frame(node = unique(c(link_df$source, link_df$target))) %>%
  mutate(idx = row_number()-1)

# node_df에서 index값을 가져와서 source와 target에 해당하는 index 값을 저장한다
link_df = link_df %>%
  left_join(node_df %>% rename(source_idx = idx), by=c('source' = 'node')) %>%
  left_join(node_df %>% rename(target_idx = idx), by=c('target' = 'node'))
완성된 데이터는 다음과 같은 형태를 가진다
node_df
##              node idx
## 1       Microsoft   0
## 2         Samsung   1
## 3        Motorola   2
## 4           Nokia   3
## 5             HTC   4
## 6           Kodak   5
## 7          Oracle   6
## 8           Apple   7
## 9              LG   8
## 10            RIM   9
## 11           Sony  10
## 12       Qualcomm  11
## 13         Huawei  12
## 14       Ericsson  13
## 15         Amazon  14
## 16 Barnes & Noble  15
## 17        Foxconn  16
## 18         Google  17
## 19       Inventec  18
## 20            ZTE  19
link_df
##       source         target      type source_idx target_idx
## 1  Microsoft         Amazon licensing          0         14
## 2  Microsoft            HTC licensing          0          4
## 3    Samsung          Apple      suit          1          7
## 4   Motorola          Apple      suit          2          7
## 5      Nokia          Apple  resolved          3          7
## 6        HTC          Apple      suit          4          7
## 7      Kodak          Apple      suit          5          7
## 8  Microsoft Barnes & Noble      suit          0         15
## 9  Microsoft        Foxconn      suit          0         16
## 10    Oracle         Google      suit          6         17
## 11     Apple            HTC      suit          7          4
## 12 Microsoft       Inventec      suit          0         18
## 13   Samsung          Kodak  resolved          1          5
## 14        LG          Kodak  resolved          8          5
## 15       RIM          Kodak      suit          9          5
## 16      Sony             LG      suit         10          8
## 17     Kodak             LG  resolved          5          8
## 18     Apple          Nokia  resolved          7          3
## 19  Qualcomm          Nokia  resolved         11          3
## 20     Apple       Motorola      suit          7          2
## 21 Microsoft       Motorola      suit          0          2
## 22  Motorola      Microsoft      suit          2          0
## 23    Huawei            ZTE      suit         12         19
## 24  Ericsson            ZTE      suit         13         19
## 25     Kodak        Samsung  resolved          5          1
## 26     Apple        Samsung      suit          7          1
## 27     Kodak            RIM      suit          5          9
## 28     Nokia       Qualcomm      suit          3         11
데이터를 모두 준비하고 나면 forceNetwork 함수로 그래프를 생성할 수 있다
함수의 동작을 위해 최소한 필요한 옵션은 다음과 같다
Links에는 link가 담긴 data.frame
Nodes에는 node가 담긴 data.frame
Source에는 Links에서 source의 index가 담긴 열 이름
Target에는 Links에서 target의 index가 담긴 열 이름
NodeID에는 Nodes에서 node이름이 담긴 열 이름
Group은 Nodes에서 group이름이 담긴 열 이름(없으면 NodeID와 동일하게)
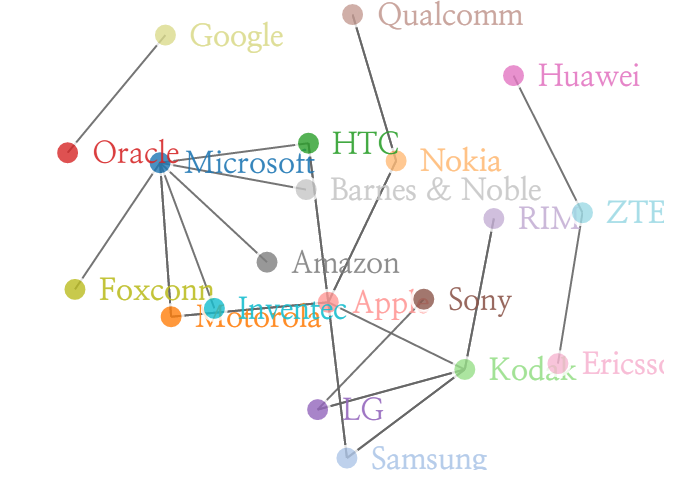
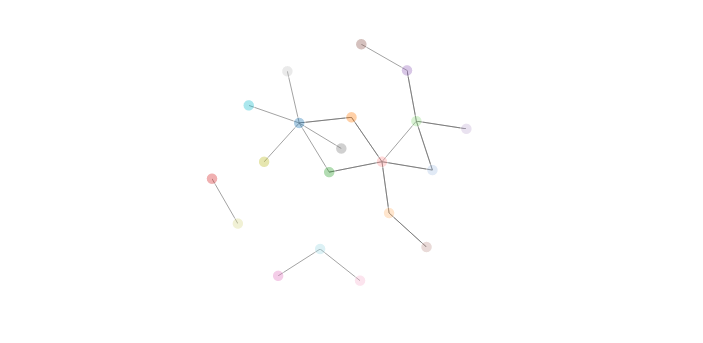
forceNetwork(Links = link_df, Nodes = node_df,
             Source = 'source_idx', Target = 'target_idx',
             NodeID = 'node', Group = 'node')
bounded 옵션을 TRUE로 하면 Node들이 특정 범위 밖으로 나가지 못하는 범위가 생긴다
opacityNoHover 옵션을 TRUE로 하면 마우스를 node에 올리지 않아도 label이 보인다
forceNetwork(Links = link_df, Nodes = node_df,
             Source = 'source_idx', Target = 'target_idx',
             NodeID = 'node', Group = 'node',
             bounded = TRUE,
             opacityNoHover = TRUE)
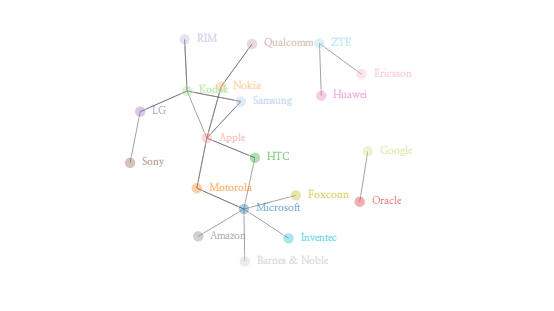
zoom = TRUE로는 zoom을 가능하게 한다
forceNetwork(Links = link_df, Nodes = node_df,
             Source = 'source_idx', Target = 'target_idx',
             NodeID = 'node', Group = 'node',
             bounded = TRUE,
             opacityNoHover = TRUE,
             zoom = TRUE)
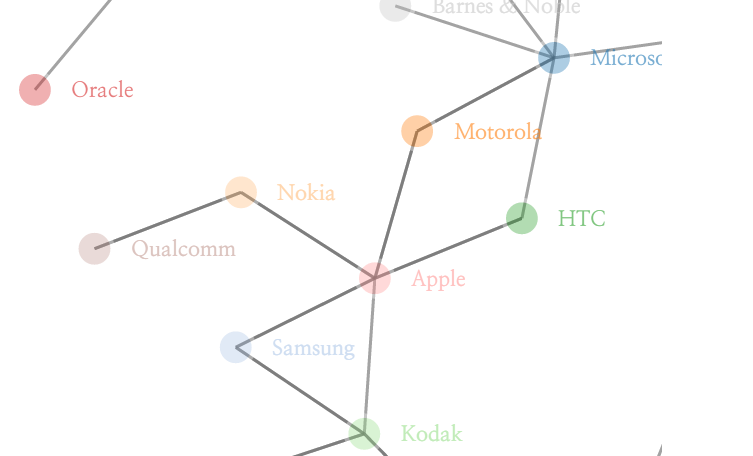
fontSize는 폰트 크기
linkDistance는 link의 길이
opacity는 전체적인 투명도를 조절한다
forceNetwork(Links = link_df, Nodes = node_df,
             Source = 'source_idx', Target = 'target_idx',
             NodeID = 'node', Group = 'node',
             opacityNoHover = TRUE,
             zoom = TRUE,
             fontSize = 15,
             linkDistance = 75,
             opacity = 0.9)